von Grazyna | Dez 28, 2022
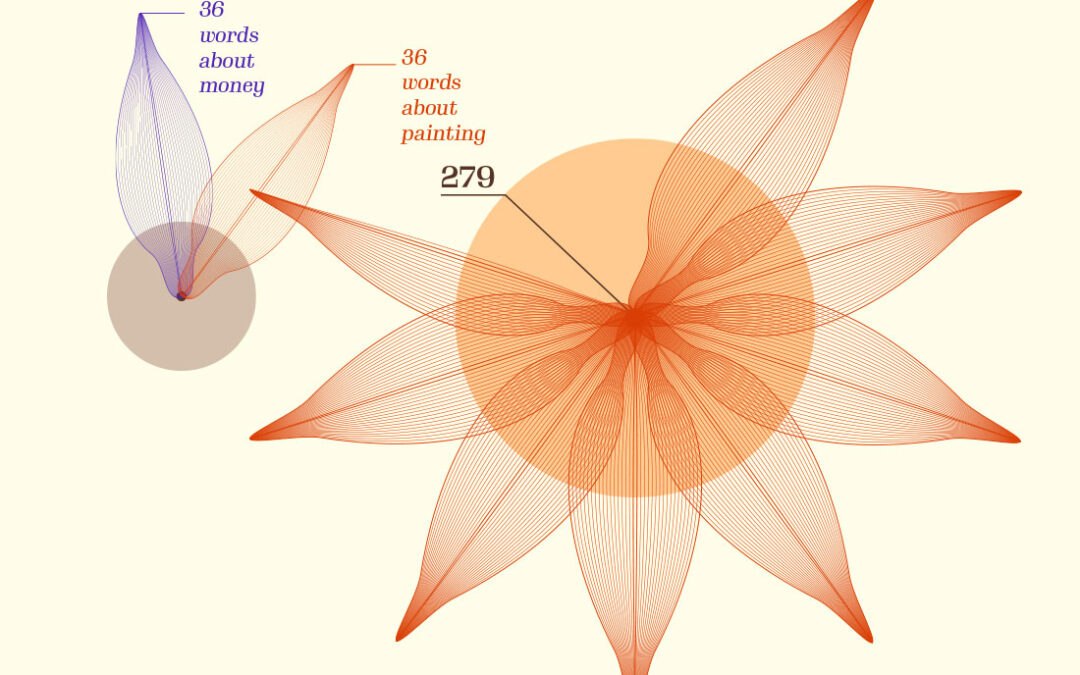
Back to all WORKS CLIENT: free project DATE: February 2022 *** Description: DATA VISUALISATION project created at the workshop hosted by Graphic Hunters “Finding Elegance: designing with data” and run by Federica Fragapane. Diagram of Vincent van Gogh’s letters. The...

von Grazyna | Mai 23, 2022
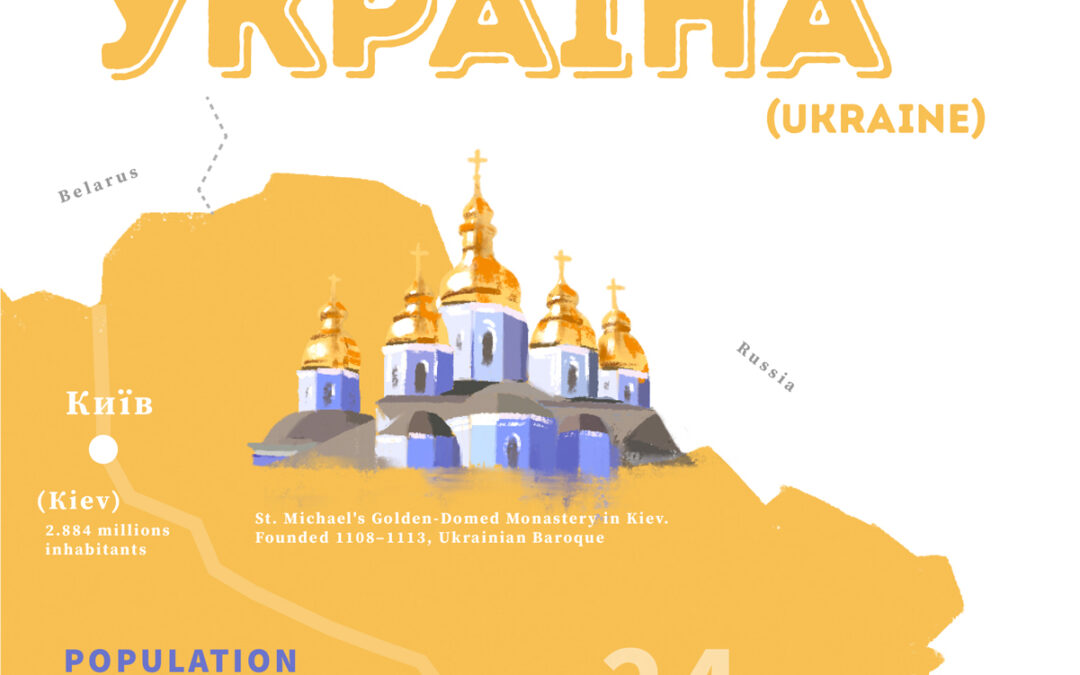
Back to all WORKS DATA VISUALISATION “Ukraine” – a free project created during the Russian invasion on Ukraine We all talk about Ukraine, but: how much do you know about this state? Here we go: the infographic displaying major facts and numbers...

von Grazyna | Apr 20, 2018
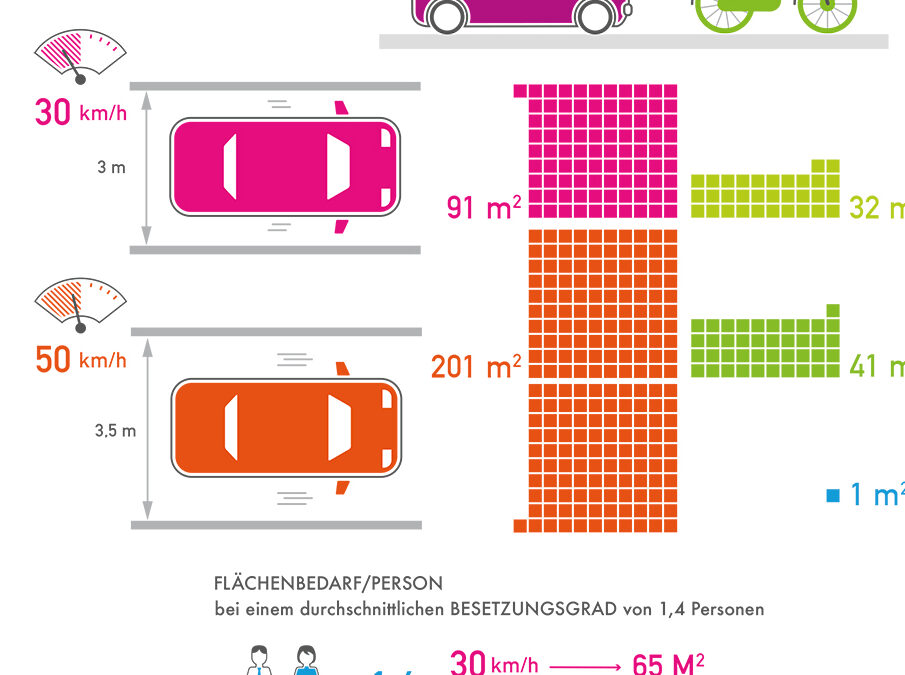
Back to WORKS DATA VISUALISATION project for the AGFScommissioned by the P3 Agency, Cologne Die AGFS (Arbeitsgemeinschaft fußgänger- und fahrradfreundlicher Städte, Gemeinden und Kreise in NRW e.V.) setzt sich für mehr Rad- und Fußverkehr in den Städten von...

von Grazyna | Jan 7, 2018
Back to WORKS ANIMATION about the multilingualism in North Rhine-Westphalia region, Germany Animierte Infografik über Daten und Fakten zur Mehrsprachigkeit und zum Erlernen der Fremdsprachen in den früheren Lebensjahren. Developed for the “Integrationsrat”...
Neueste Kommentare